
My previous post described a web-service for providing up-to-date UK political polling information. I’ve created a Python client to make use of this to perform simple analysis.
This allows you quickly do analysis such as polling a monthly average of the parties polling results.
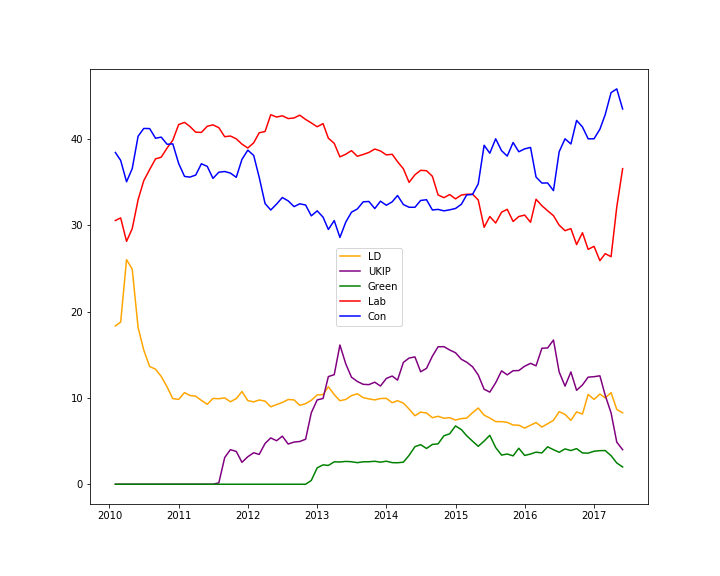
This can be generated using code like this.
from datetime import datetime
import pandas as pd
from pollingclient.client import PollingClient

pc = PollingClient()
dfm = pc.monthly_average()
dfm = dfm[dfm.index>datetime(2010,1,1)]
color_map = {'Con': 'blue', 'Lab': 'red', 'LD': 'orange', 'Green': 'green', 'UKIP': 'purple'}
colors = [color_map[x] for x in dfm.columns]
dfm.plot(style=colors);
Or another example, list the months in which Labour had the lowest average poll rating while in opposition.
| Con | Lab | LD | UKIP | Green | |
|---|---|---|---|---|---|
| Feb 2017 | 41.1 | 25.9 | 10.4 | 12.6 | 3.9 |
| Dec 1981 | 25.0 | 26.2 | 46.8 | 0.0 | 0.0 |
| Jun 1982 | 48.3 | 26.3 | 24.0 | 0.0 | 0.0 |
| Apr 2017 | 45.3 | 26.3 | 10.6 | 8.3 | 3.3 |
| Sep 1983 | 45.5 | 26.7 | 26.3 | 0.0 | 0.0 |
And the code for this.
dfm = pc.monthly_average()
l_in = dfm[list(dfm.index.map(lambda x: not pc.party_in_power('Lab', x)))]
dfx = l_in.sort_values("Lab").round(1).head(5)
dfx.index = dfx.index.strftime('%b %Y')
print dfx
Installation
The code can be found here on github.
You can install it from there like this:
pip install -e git+https://github.com/NickAltmann/UKPollingClient#egg=pollingclient
Examples of use
There are some notebook files on github here which illustrate the interface and provide further examples of what can be done.
Source credit
Please see my previous post about crediting the sources of this data.